Tables
Last updated: October 29, 2024
Tables function very similarly to Excel’s native “Pivot Table” feature. You are able to embed a mix of dimensions within your Rows and Columns and showcase data in a table structure.
As an example, we will filter our ERP data to create a P&L based on the type of account (Income, COGS, Expense, etc..). In this case, both “Account Type” and “Account” are selected in the row.

Importantly, you can pre-configure the table to be formatted with Subtotals and Grand Totals and to display natively as Financial data. This can be done by going to the “Data” pane, and selecting the gear icon in the “Additional Settings” area. This will open up a more advanced formatting pane.
There are also pre-built calculations for ERP-based data and general data. These can be used to automatically calculate things such as Gross Margin, Net Income, and to show various differences. Further explanation for both advanced formatting and custom calculations can be found below.
Additional Table Settings
Custom Table Formatting
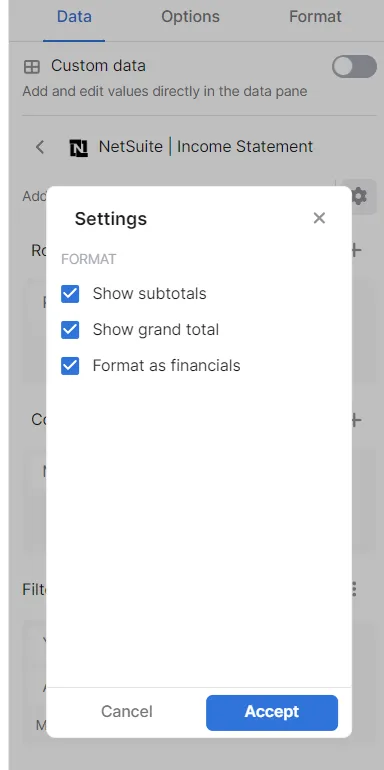
Show Subtotals: When two or more dimensions are selected as rows, this will create a subtotal if there is an existing relationship between the data. As an example, if there is an existing Account Hierarchy or Mapping, you’ll see the highest level shown at the top, with each detailed category beneath it.
Show Grand Total: This will show the total amount across all categories.
Format as Financials: This will remove the individual cell borders, add indentations for the rows, and is generally more friendly to look at. Below are screenshots of the same data set with the “Format as Financials” setting toggled on vs off.
Format as Financials On:
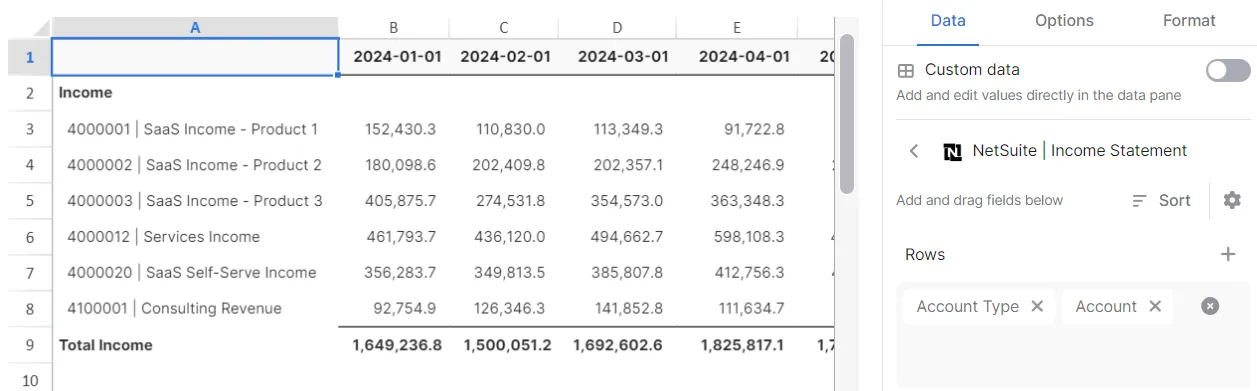
Format as Financials Off:

Custom Row and Column Calculations
When adding a row or column, additional settings can be found within the “Select rows” and "Select columns" areas.

Rows: Adding any of these “Calculated Items” will have them appear at the bottom of the existing table.
The default options for most dimensions will only show “Difference” and “Difference %”
ERP Data will often contain the “Account Type” dimension by default, which will display multiple options for P&L calculations such as Gross Profit and Net Income.
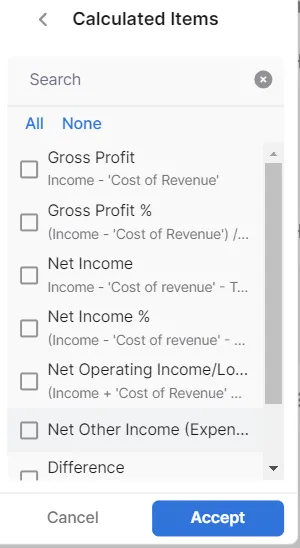
Columns: Adding any of these “Calculated Items” will have them appear individually next to each column within the table.
The default options for most dimensions will only show “Difference” and “Difference %”
Monthly data that includes dates will also have an option to select “Year To Date” - showing the current YTD value next to each column.
Options
This gives you the ability to limit the range of data in your table. As an example, if there’s no filter on Year, you could choose to show the first 12 months of any data set.
Format
Conditional formatting can be applied to the items found in the columns of the Data Pane. You can custom format either the background color or the font color of the conditional cells. The other options are straightforward in their explanation, and will apply automatically to any data point that meets the criteria. Multiple conditions can be added for the same dataset, which can significantly help to highlight outliers when scanning through large tables.